

In 2022, the most recent year for which data is available and analyzed, GiveWell raised the largest amount of money in our history, over $600 million. We thank our donors for continuing to trust us to find and recommend highly cost-effective giving opportunities. The following table summarizes our funds raised and our funds directed to programs in metrics year 2021 and 2022.1GiveWell’s metrics year runs from February 1 through January 31 of the following year; the 2022 metrics year ran from February 1, 2022, to January 31, 2023. jQuery(‘#footnote_plugin_tooltip_14651_1_1’).tooltip({ tip: ‘#footnote_plugin_tooltip_text_14651_1_1’, tipClass: ‘footnote_tooltip’, effect: ‘fade’, predelay: 0, fadeInSpeed: 200, delay: 400, fadeOutSpeed: 200, position: ‘top right’, relative: true, offset: [10, 10], });
2021
2022
Y/Y Growth
Funds Raised
$595,489,935
$602,889,435
1%
Funds Directed2In 2022, as in 2021, we raised more funds than we directed. For more on this, see the funds directed section below. jQuery(‘#footnote_plugin_tooltip_14651_1_2’).tooltip({ tip: ‘#footnote_plugin_tooltip_text_14651_1_2’, tipClass: ‘footnote_tooltip’, effect: ‘fade’, predelay: 0, fadeInSpeed: 200, delay: 400, fadeOutSpeed: 200, position: ‘top right’, relative: true, offset: [10, 10], });
$529,426,944
$439,391,294
-17%
For more information on our 2022 funds raised, funds directed, operational expenses, and donor metrics, see our impact page and our full metrics report.
A note on timing
This post covers funds raised and directed in our metrics year 2022 (spanning February 1, 2022 to January 31, 2023). Our metrics report is typically published at least six months after the close of the metrics year because we need to collect data on donations we influence from third parties and then cross-check that data to ensure we aren’t double-counting any funds. This year we were additionally delayed by competing internal priorities.
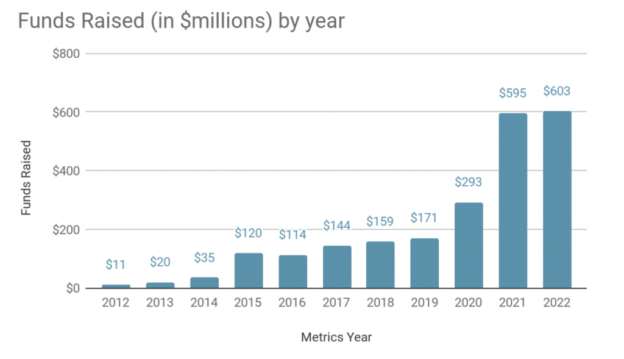
Funds raised
In 2022, we raised slightly more funding than during 2021, and substantially more than prior years.3Note that the chart refers to our historical funds raised. The figures for 2020 and earlier refer to our “money moved,” which tracked the funding that was both raised and directed in a given year. We are now reporting on funds raised and funds directed separately, which we believe is simpler and clearer. jQuery(‘#footnote_plugin_tooltip_14651_1_3’).tooltip({ tip: ‘#footnote_plugin_tooltip_text_14651_1_3’, tipClass: ‘footnote_tooltip’, effect: ‘fade’, predelay: 0, fadeInSpeed: 200, delay: 400, fadeOutSpeed: 200, position: ‘top right’, relative: true, offset: [10, 10], });
We are excited by a continuing trend of donors trusting GiveWell to allocate their donation (e.g., by giving to one of our Giving Funds) instead of choosing to restrict their donation