

Tag: GiveWell internal metrics
-
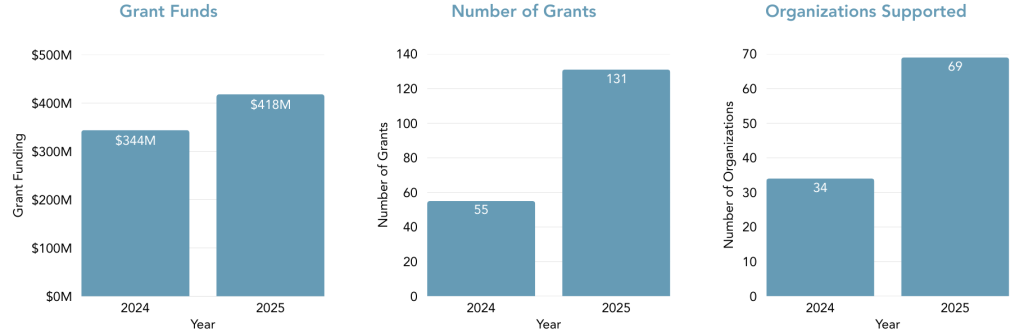
GiveWell’s 2025 Grantmaking: Record Grants, Expanded Reach, Crisis Response
In our 2025 grantmaking year, GiveWell approved $418 million in grants to highly cost-effective programs in order to save and improve lives as much as we can. Through years of deliberate groundwork, we’ve been growing our research capacity and scope in order to direct substantially more funding to the most impactful opportunities we can find.…
-
GiveWell’s 2024 Metrics and Impact
Thanks to the generosity of more than 30,000 donors, GiveWell raised $415 million and directed $397 million to cost-effective programs in metrics year 2024 (February 2024 to January 2025).1 GiveWell’s metrics year runs from February 1 through January 31. Our metrics report is typically published at least six months after the close of the metrics…
-
GiveWell’s 2022 metrics report
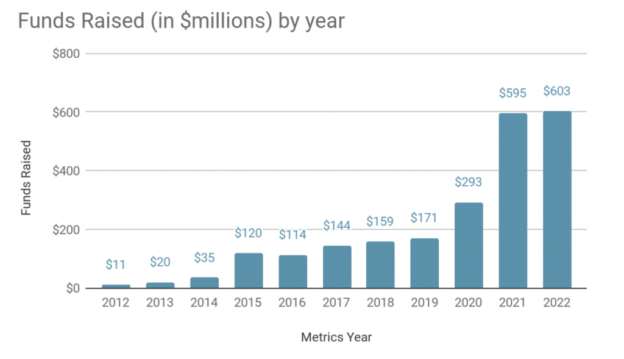
In 2022, the most recent year for which data is available and analyzed, GiveWell raised the largest amount of money in our history, over $600 million. We thank our donors for continuing to trust us to find and recommend highly cost-effective giving opportunities. The following table summarizes our funds raised and our funds directed to…
-
How much funding does GiveWell expect to raise through 2025?
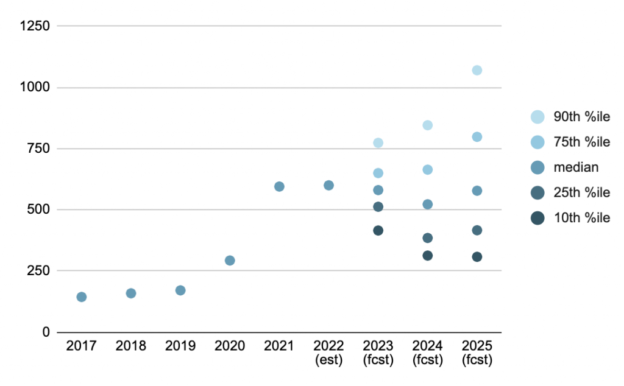
Summary We’re optimistic that GiveWell’s funds raised will continue to increase in the long run. Over the next few years, we believe our annual funds raised are more likely to stay relatively constant, due to a decrease in expected funding from our largest donor, Open Philanthropy, offset by an expected increase in funding from our…
-

Our recommendations for giving in 2022
We wrote back in July that we expected to be funding-constrained this year. That remains true as we approach the end of the year, putting us in the unusual position of leaving impact on the table. We’ve set a goal of raising $600 million in 2022, but our research team has identified $900 million in…
-
GiveWell’s 2021 metrics report
In 2021, GiveWell directed the largest amount of money in our history, over $500 million, which we believe will be beneficial or life saving to many people in need. We thank our donors for continuing to trust us to find and recommend some of the most highly cost-effective giving opportunities in the world. Note that…
-
An update on GiveWell’s funding projections
As little as six months ago, we were in the position of having more funding available than we could spend on opportunities that met our very high cost-effectiveness bar. Today, the opposite is true—we don’t expect to have enough funding to support all the cost-effective opportunities we find. In this post we will: provide an…
-
Our recommendations for giving in 2021
You can have a remarkable impact by supporting cost-effective, evidence-based charities. Just looking at the approximately $100 million[1] GiveWell had discretion to grant in 2020—a subset of all the money we directed to the charities we recommend—the impact of our donors is impressive. We estimate these grants will: Save more than 24,000 lives Treat over…
-
GiveWell’s money moved in 2020
2020 was another year of tremendous growth. GiveWell donors contributed over $240 million to our recommended charities (our “2020 money moved”), a 60% increase from the approximately $150 million we directed in 2019. This is part of an exciting, long-term trend. Just a decade ago, in 2010, GiveWell’s total money moved was $1.5 million.[1] We…
-
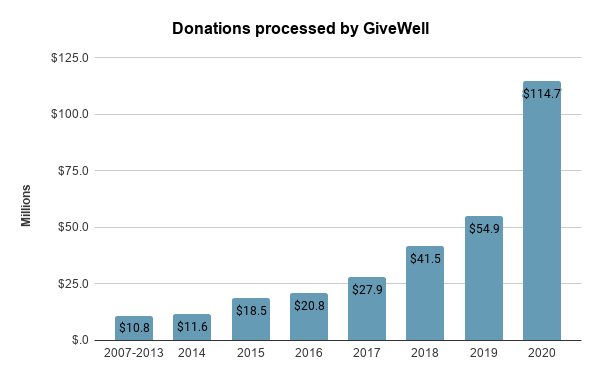
Early signs show that you gave more in 2020 than 2019—thank you!
Our donor community appears to have given significantly more in 2020 than 2019, according to early data on donations we processed. Growth was strong relative to previous years—even 2019, which also had strong growth—and across many different dimensions. Overall, donations to GiveWell more than doubled in 2020. We estimate that these donations will collectively save…
-
GiveWell’s plans for 2020
Each spring, we share our plans for the year. Here, we highlight the work we plan to do in 2020 that is most likely to help us realize our mission of identifying and directing funding to highly cost-effective giving opportunities.1This post does not include a complete accounting of everything we plan to do in 2020.…
-
Reflecting on our progress in 2019
GiveWell grew significantly in 2019. We hired 13 full-time staff members, bringing our total size to 37, and expanded our ability to take on new projects across domains. We feel positioned to do more and better work going forward as a result. We see a strong indication that the amount of funding we directed to…