Tag Archives: Evaluation of GiveWell

GiveWell’s 2022 metrics report

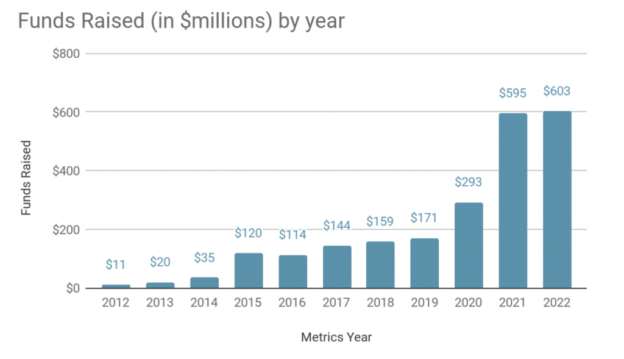
In 2022, the most recent year for which data is available and analyzed, GiveWell raised the largest amount of money in our history, over $600 million. We thank our donors for continuing to trust us to find and recommend highly cost-effective giving opportunities. The following table summarizes our funds raised and our funds directed to programs in metrics year 2021 and 2022.1GiveWell’s metrics year runs from February 1 through January 31 of the following year; the 2022 metrics year ran from February 1, 2022, to January 31, 2023. jQuery(‘#footnote_plugin_tooltip_14651_1_1’).tooltip({ tip: ‘#footnote_plugin_tooltip_text_14651_1_1’, tipClass: ‘footnote_tooltip’, effect: ‘fade’, predelay: 0, fadeInSpeed: 200, delay: 400, fadeOutSpeed: 200, position: ‘top right’, relative: true, offset: [10, 10], });

2021
2022
Y/Y Growth

Funds Raised
$595,489,935
$602,889,435
1%

Funds Directed2In 2022, as in 2021, we raised more funds than we directed. For more on this, see the funds directed section below. jQuery(‘#footnote_plugin_tooltip_14651_1_2’).tooltip({ tip: ‘#footnote_plugin_tooltip_text_14651_1_2’, tipClass: ‘footnote_tooltip’, effect: ‘fade’, predelay: 0, fadeInSpeed: 200, delay: 400, fadeOutSpeed: 200, position: ‘top right’, relative: true, offset: [10, 10], });
$529,426,944
$439,391,294
-17%

For more information on our 2022 funds raised, funds directed, operational expenses, and donor metrics, see our impact page and our full metrics report.
A note on timing
This post covers funds raised and directed in our metrics year 2022 (spanning February 1, 2022 to January 31, 2023). Our metrics report is typically published at least six months after the close of the metrics year because we need to collect data on donations we influence from third parties and then cross-check that data to ensure we aren’t double-counting any funds. This year we were additionally delayed by competing internal priorities.
Funds raised
In 2022, we raised slightly more funding than during 2021, and substantially more than prior years.3Note that the chart refers to our historical funds raised. The figures for 2020 and earlier refer to our “money moved,” which tracked the funding that was both raised and directed in a given year. We are now reporting on funds raised and funds directed separately, which we believe is simpler and clearer. jQuery(‘#footnote_plugin_tooltip_14651_1_3’).tooltip({ tip: ‘#footnote_plugin_tooltip_text_14651_1_3’, tipClass: ‘footnote_tooltip’, effect: ‘fade’, predelay: 0, fadeInSpeed: 200, delay: 400, fadeOutSpeed: 200, position: ‘top right’, relative: true, offset: [10, 10], });

We are excited by a continuing trend of donors trusting GiveWell to allocate their donation (e.g., by giving to one of our Giving Funds) instead of choosing to restrict their donation

Givewell Blog | http://feeds.feedburner.com/TheGivewellBlog

Goto full post >>

The winners of the Change Our Mind Contest—and some reflections

In September, we announced the Change Our Mind Contest for critiques of our cost-effectiveness analyses. Today, we’re excited to announce the winners!
We’re very grateful that so many people engaged deeply with our work. This contest was GiveWell’s most successful effort so far to solicit external criticism from the public, and it wouldn’t have been possible without the participation of people who share our goal of allocating funding to cost-effective programs.
Overall, we received 49 entries engaging with our prompts. We were very happy with the quality of entries we received—their authors brought a great deal of thought and expertise to engaging with our cost-effectiveness analyses.
Because we were impressed by the quality of entries, we’ve decided to award two first-place prizes and eight honorable mentions. (We stated in September that we would give a minimum of one first-place, one runner-up, and one honorable mention prize.) We also awarded $20,000 to the piece of criticism that inspired this contest.
Winners are listed below, followed by our reflections on this contest and responses to the winners.
The prize-winners
Given the overall quality of the entries we received, selecting a set of winners required a lot of deliberation.
We’re still in the process of determining which critiques to incorporate into our cost-effectiveness analyses and to what extent they’ll change the bottom line; we don’t agree with all the critiques in the first-place and honorable mention entries, but each prize-winner raised issues that we believe were worth considering. In several cases, we plan to further investigate the questions raised by these entries.
Within categories, the winners are listed alphabetically by the last name of the author who submitted the entry.
First-place prizes – $20,000 each1Both of these entries were outstanding, and they represent very different approaches. Because they are similarly excellent, we are naming two winners rather than one winner and one runner-up. jQuery(‘#footnote_plugin_tooltip_14065_1_1’).tooltip({ tip: ‘#footnote_plugin_tooltip_text_14065_1_1’, tipClass: ‘footnote_tooltip’, effect: ‘fade’, predelay: 0, fadeInSpeed: 200, delay: 400, fadeOutSpeed: 200, position: ‘top right’, relative: true, offset: [10, 10], });

Noah Haber for “GiveWell’s Uncertainty Problem.” The author argues that without properly accounting for uncertainty, GiveWell is likely to allocate its portfolio of funding suboptimally, and proposes methods for addressing uncertainty.
Matthew Romer and Paul Romer Present for “An Examination of GiveWell’s Water Quality Intervention Cost-Effectiveness Analysis.” The authors suggest several changes to GiveWell’s analysis of water

Givewell Blog | http://feeds.feedburner.com/TheGivewellBlog

Goto full post >>

Announcing the Change Our Mind Contest for critiques of our cost-effectiveness analyses

We’re extremely excited to be announcing the Change Our Mind Contest to encourage critiques of our cost-effectiveness analyses that could lead to substantial improvements of our overall allocation of funds. For all the details, see this page.
Cost-effectiveness is the single most important input in our decisions about what programs to recommend, and we believe it’s possible that we’re missing important considerations or making mistakes that lead us to allocate funding suboptimally. We’ve been excited to see people engaging with our cost-effectiveness analyses, and we’d like to inspire more of that engagement.
With that in mind, we’re inviting you to identify potentially important mistakes or weaknesses in our existing cost-effectiveness analyses and tell us about them!
The first-place winning entry will receive $20,000, the runner-up will receive $10,000, and the honorable mention will receive $5,000. We may offer multiple runner-up and honorable mention prizes if the quality of submissions is particularly high. All other entries that meet our criteria will receive a participation prize of $500, capped at a total of 50 participation prizes for the first 50 submissions.
In addition to the monetary prizes, excellent entries may lead to changes in how we allocate millions of dollars of funding, leading to more lives saved or improved.
Entries must be received by October 31, 2022, and the requirements are described in detail on the contest page. We will announce winners by December 15, 2022, and will publish the winning entries online.
If you have any questions, please leave a comment on this post or email change-our-mind@givewell.org.
We’re running this contest because the recommendation decisions we make are extremely important, and we want to incentivize feedback that will improve our work, thereby enabling us to do more good. We hope you’ll consider participating!
The post Announcing the Change Our Mind Contest for critiques of our cost-effectiveness analyses appeared first on The GiveWell Blog.

Givewell Blog | http://feeds.feedburner.com/TheGivewellBlog

Goto full post >>

GiveWell’s 2021 metrics report

In 2021, GiveWell directed the largest amount of money in our history, over $500 million, which we believe will be beneficial or life saving to many people in need. We thank our donors for continuing to trust us to find and recommend some of the most highly cost-effective giving opportunities in the world.
Note that this year, we’ve also updated our metrics report to more clearly communicate about our work. Previously, we reported on our “money moved,” a metric that tried to provide a composite picture of both the funds we raised and directed in a given year. However, starting with our 2021 report, we’ll be reporting on these metrics separately as “funds raised” and “funds directed,” which we believe will be simpler and clearer.
The following tables summarize our funds raised and funds directed in 2021:

This represents a significant increase in the funds we raise on a yearly basis, from only $11 million in 2012 to $595 million in 2021.

You’ll note that our funds directed in 2021 is about $66 million lower than our funds raised. The funds we raised that were not directed include:

“Contingency funds” committed to charities under particular grant agreements but only paid out under certain conditions of the grant. (If those conditions are not met, we reallocate the funding to other opportunities.)
“Rollover funds” saved for grantmaking in future years.
Maximum Impact Fund donations raised in a given metrics year but allocated in the following year (these appear as funds directed in the following year).
Unrestricted funds raised in a given metrics year but not spent on operations or granted out to charities in that year (these appear as funds directed in the year they are allocated).

For more information, please see our full report.
The post GiveWell’s 2021 metrics report appeared first on The GiveWell Blog.

Givewell Blog | http://feeds.feedburner.com/TheGivewellBlog

Goto full post >>

GiveWell’s money moved in 2020

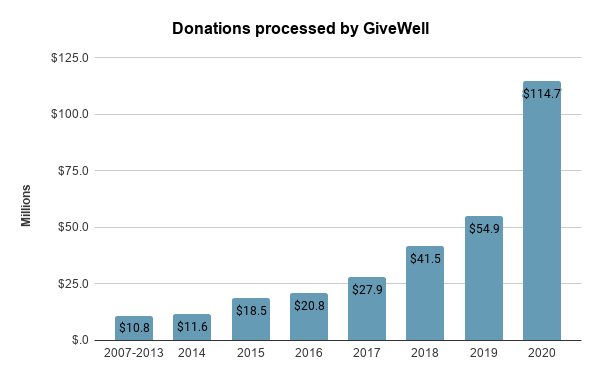
2020 was another year of tremendous growth. GiveWell donors contributed over $240 million to our recommended charities (our “2020 money moved”), a 60% increase from the approximately $150 million we directed in 2019. This is part of an exciting, long-term trend. Just a decade ago, in 2010, GiveWell’s total money moved was $1.5 million.[1]
We believe these donations will save tens of thousands of lives and benefit many others. This incredible impact would not be possible without the continued support and generosity of our donors. While our research enables us to identify and recommend highly cost-effective giving opportunities, our donors are responsible for turning those recommendations into real change for some of the poorest individuals in the world.
This post lays out highlights from our final 2020 money moved report and shares more details about how donors gave to GiveWell’s recommended charities in 2020.[2]

Summary of influence: In 2020, GiveWell influenced charitable giving in several ways. The following table summarizes our understanding of this influence.

Headline money moved: In 2020, we confidently tracked $244 million in money moved to our recommended charities, and via our GiveWell Incubation Grants program. This amount, which we call “headline money moved,” only counts donations that we are confident were influenced by our recommendations. This includes the grants we make through the Maximum Impact Fund. See Appendix 1 of our 2020 metrics report for additional details on how we calculate our money moved.
We also estimate that we are responsible for an additional $3 million in donations, but we are unable to attribute these donations directly to GiveWell. Because we are more uncertain about this influence, we do not include this amount in our “headline money moved” figure but include it in our “best guess of total money directed to charities” figure. [3]
The chart below shows the breakdown of our headline money moved into the following categories: grants that Open Philanthropy made to our recommended charities, donations from other donors to our recommended charities, and Incubation Grants. Please note that Open Philanthropy support (marked in gray) does not include funding it provided for GiveWell Incubation Grants, which are shown separately in purple. [4]

Money moved by charity (excluding Incubation Grants): Our nine top charities received the majority of our money moved. Our nine standout charities received a total of $2.2 million.

Givewell Blog | http://feeds.feedburner.com/TheGivewellBlog

Goto full post >>

Early signs show that you gave more in 2020 than 2019—thank you!

Our donor community appears to have given significantly more in 2020 than 2019, according to early data on donations we processed.
Growth was strong relative to previous years—even 2019, which also had strong growth—and across many different dimensions. Overall, donations to GiveWell more than doubled in 2020.
We estimate that these donations will collectively save more than 12,000 lives; provide over 2 million deworming treatments to children, leading to an approximate increase in that group’s lifetime earnings of more than $21 million; and deliver almost 3,000 cash transfers to low-income households. For simplicity, the impact estimates in this paragraph exclude some donation types, and so don’t represent the full impact of donations to GiveWell in 2020.[1]
“Donations to GiveWell” refers to donations that we received directly:

It includes donations to GiveWell for our recommended organizations—including for the Maximum Impact Fund—and unrestricted funding, which may be used for our operations.[2]
It excludes donations that were made directly to our recommended organizations (via their own donation platforms) as a direct result of our research, or to other groups that accept donations for GiveWell and/or our recommended organizations, since we don’t yet have complete information about those donations.[3] It also excludes GiveWell Incubation Grant funding.[4] Most donations from Open Philanthropy, a major philanthropic grantmaker with which we work closely, are part of this excluded category because they were made directly to our recommended organizations.[5]We expect these excluded donations to account for a large proportion of total funding we influenced last year. For example, in 2019, we received $54.9 million in “donations to GiveWell.” When we received complete information about donations made directly to our recommended organizations or groups supporting them due to our research, and included them in our assessment of our influence, the amount of money we tracked increased to $155.1 million.[6]

While this post is only a preliminary look at our donors’ collective giving last year, the early signs show incredible growth. Thank you to our donor community!
The takeaway: donations to GiveWell more than doubled
We received more than twice as much funding in 2020 as we did in 2019.
Please click to see larger image.
All amounts are rounded to the nearest $100,000. This chart excludes most support from Open Philanthropy and most GiveWell Incubation Grants.[7]
A caveat: we can slice our data in many different ways. Please take care

Givewell Blog | http://feeds.feedburner.com/TheGivewellBlog

Goto full post >>

GiveWell’s plans for 2020

Each spring, we share our plans for the year. Here, we highlight the work we plan to do in 2020 that is most likely to help us realize our mission of identifying and directing funding to highly cost-effective giving opportunities.1This post does not include a complete accounting of everything we plan to do in 2020. In particular, it does not include work aimed at primarily internal-facing results, such as improvements to internal staff communications. jQuery(“#footnote_plugin_tooltip_1”).tooltip({ tip: “#footnote_plugin_tooltip_text_1”, tipClass: “footnote_tooltip”, effect: “fade”, fadeOutSpeed: 100, predelay: 400, position: “top right”, relative: true, offset: [10, 10] }); We focus on three projects:

Expanding into new areas of research.
Searching for new, cost-effective funding opportunities in our traditional research areas.
Building our donor community.

Sharing our annual plans and publicly reflecting back on them a year later is our typical practice. This year, of course, is atypical. The plans we laid out internally at the beginning of the year have been disrupted by the COVID-19 pandemic. The plans we share in this post take the pandemic into account, but we are more uncertain than usual about what will happen in 2020. We expect that much of our work will go forward as anticipated, but we will be flexible if there are unforeseen disruptions or changes to our research agenda that result from the pandemic.
Expanding into new areas of research
Grants in response to the pandemic
We have already expanded into a new area of work in 2020: grantmaking in response to the COVID-19 pandemic. We don’t typically focus on high-uncertainty, short-timeline reviews of funding opportunities. However, we think that we should be open to making grants in a lower-information environment due to the potentially severe consequences of the pandemic in low- and middle-income countries, where we focus our work, and that acting sooner may be more impactful in preventing the spread of the disease. As of the publication of this post, we’ve made three grants for COVID-19 mitigation.
We plan to consider whether there are additional grants we should make in response to the pandemic. We will make these grants if we believe they are more cost-effective than the opportunities to which we would otherwise direct funds.
Prioritizing within public health regulation
We began this year with the goal of clarifying which areas were most promising within public health regulation, a relatively new-to-GiveWell domain that we see as potentially highly cost-effective but that

Givewell Blog | http://feeds.feedburner.com/TheGivewellBlog

Goto full post >>

Reflecting on our progress in 2019

GiveWell grew significantly in 2019. We hired 13 full-time staff members, bringing our total size to 37, and expanded our ability to take on new projects across domains. We feel positioned to do more and better work going forward as a result.
We see a strong indication that the amount of funding we directed to our recommended charities increased last year, too. While we haven’t reconciled all giving from 2019, the value of donations we processed increased by about 30% in 2019.
We’re proud of what we accomplished in 2019. We also fell short of some goals last year. Most notably, we failed to make as much progress as we planned in researching new areas of global health and poverty alleviation.
This blog post provides a brief look at our key successes and failures last year. A more detailed accounting of how our progress in 2019 compared to the goals we set is available on this page.
Successes
Hiring new staff
Years of planning for our needs and recruiting efforts culminated in hiring 13 new staff to join our small team in 2019. GiveWell ended last year over 50% bigger than it was at the end of 2018.
We hired across the domains of our work: seven joined the research team, two joined the outreach team, three joined the operations team, and one will serve as Managing Director. We expect each staff member will enable us to accomplish more and achieve better outcomes across these key areas of our work. Below, we highlight a few senior hires whom we expect to help steer the direction of our work.

Managing Director. We hired Neil Buddy Shah as our first Managing Director in late 2019. Buddy will work closely with GiveWell’s CEO Elie Hassenfeld to set GiveWell’s high-level strategy. He will also engage with the international development community to learn from and contribute to discussions of how to do as much good as possible and to identify promising funding opportunities. We expect Buddy to start at GiveWell this summer.
Research. We’ve been looking to hire senior researchers to expand our ability to assess new types of evidence since 2016. We described in early 2019 how our research is evolving and how we hoped to hire additional experienced researchers to enable us to do this work. We hired Alex Cohen and Teryn

Givewell Blog | http://feeds.feedburner.com/TheGivewellBlog

Goto full post >>